Theory: That near all the energy of a stretched string is transferred to a cart to make it move, so the stored energy is transferred to give the cart kinetic energy, and this amount of energy can be determined by the area underneath a graph of Force vs position.
Procedure: Set up a track and attach a spring to a cart and force gage, and use logger pro and a motion sensor to measure the resulting force, position, and velocity from the cart because of the spring.
Eperiment 1: Graph the results and determine a K constant for the spring from a Force vs. Position data by stretching out the string.
Experiment 2: Determine the mass of the cart, set up another experiment to measure the velocity of the cart after the spring is released and set up a new graph that is "laid on top of" a Force vs. Position graph of the spring, but create a calculated column for the y-axis to measure the kinetic energy of the cart, so that it is a Kinetic Energy vs Position graph and determine if there is correlation between the two graphs.
Experiment 3: Watch a short video, determine the area under the graph in the video to find the total energy stored in a rubber band, the stored energy is then transferred to a cart, and with the given mass distance and time calculate the kinetic energy and compare it to the expected amount determined form the graph.
The System

Experiment 1
*For Experiment 1 this is the graph we got.

*The energy on a Force vs Position graph can be determined by the area underneath the line formed.
*Because the line is nearly perfectly straight, the graph is similar to a triangle.
*The area underneath a triangle 1/2 * Base*Height, and in this triangle the base is position (x) and the height is the force.
*The energy from a spring is 1/2 *Spring Constant(K)*x^2, so setting that equal to the area and solving for K should give us the spring constant.
*Because of issues calibrating, area had to be solved by hand.
*Base= 0.21 m
*Height=0.63 N
*Area=0.06615 J
*Area=1/2 *K* x^2 (x is equal to base)
*K=3 N/m
Experiment 2
*The same set up was used, though the calibration errors were fixed.
*Mass of cart was determined to be 0.539 kg.
*By measuring the velocity as the cart is pulled, the kinetic energy of the cart could be determined as it was pulled by the spring.
*Creating another graph with this calculation as the y-axis creates a Kinetic energy vs Position graph, and means that any y-point on the that graph should be equal to the area under the Force vs Position graph at the same x-point.
Graphs

*Kinetic energy equals 0.064 J, area under Force vs Position graph =0.06108

*Kinetic energy equals 0.107 J, area under Force vs Position graph =0.1073

*Kinetic energy equals 0.125 J, area under Force vs Position graph =0.1315
Experiment 3
*The Graph from the video was traced, and the are underneath was broken up into six simple shapes for calculating area (three rectangles and three triangles)
Graph
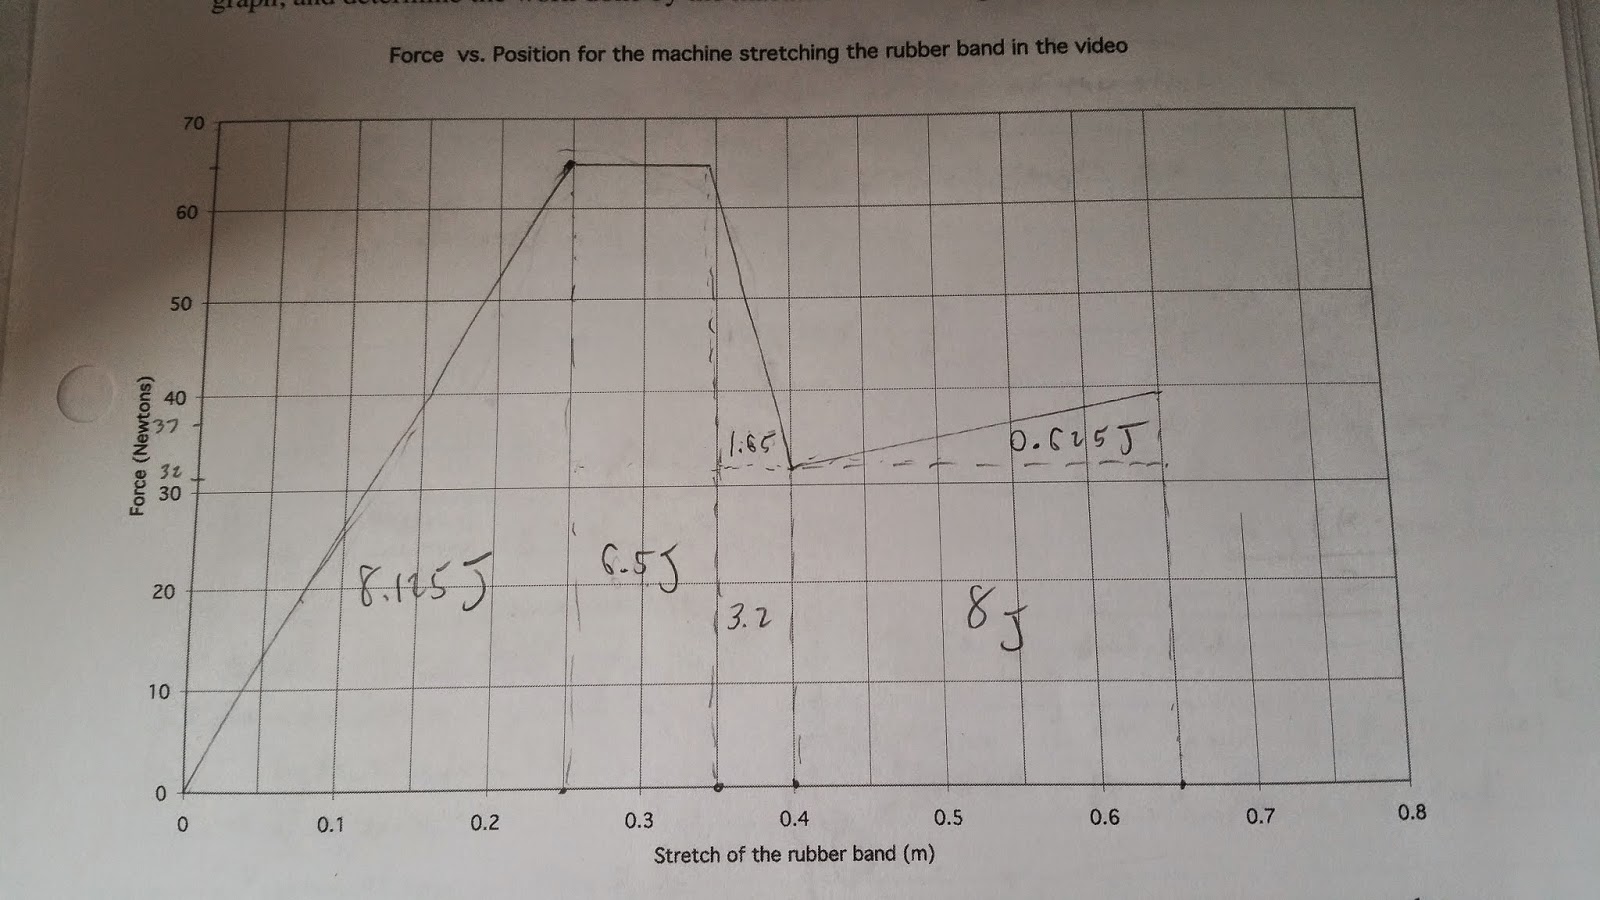
*Triangle_1=8.125 J, Triangle_2=0.825 J, and Triangle_3= 0.625 J
*Rectangle_1= 6.5 J, Rectangle_2= 1.6 J, and Rectangle_3= 8 J
*Total area= 25.675 J
*At the end of the video we were given a set distance a cart (mass= 4.3 kg) would travel (0.15 m) in 0.045 seconds from the amount of energy from the area of the above graph transferred to it.
*Since kinetic energy equals 1/2 *mass*velocity^2, the two values should be equal.
*Calculated energy = 1/2 *4.3 *(0.15/0.045)^2 = 23.89 J
Conclusion
*In Experiment 2 the calculated Kinetic energy and the area under the Force vs position graph for the spring were nearly identical (except for the area being a negative number because it was determined through integration). Trial one had 4.5% difference, trial two was exact, and trial three was 5.2 % difference. It seems obvious the energy/work from the spring was transferred to the kinetic energy for the cart.
*Flaws with the system are it doesn't account for friction from the cart and track and from the air.
*In Experiment 3 the difference was around 7.4 % between the calculated energy from how fast the cart moved from the stored energy(Kinetic energy), and the amount determined from the Force vs. Position graph.
*The Force vs. Position graph was fraught with uncertainties, as it was completely determined through "eye-balling" a grainy old time video, and trying to replicate the graph on another paper.
No comments:
Post a Comment